
Business Dashboard
Development
Turn disconnected reports into an operational dashboard with agreed metrics, understandable filters and a clear route from a number to the underlying record.
Discuss your project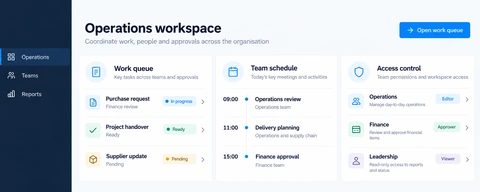
Business dashboards scope
The first dashboard decision is what a person should do differently after seeing it. We work backwards from that decision to the data sources, calculation rules and freshness the team actually needs.
Metric definitions
Document formulas, time zones, exclusions and ownership so teams interpret the same number consistently.
Data connections
Assess databases, exports and APIs, including missing records, refresh limits and reconciliation requirements.
Views and drilldowns
Plan role-specific summaries, date comparisons and source-record links instead of displaying every possible chart.
Planning business dashboards
- 1
Audit the source data
Compare a sample calculation with the current report. Record incomplete fields, duplicate events and the update frequency each source supports.
- 2
Validate the dashboard with its users
Prototype the highest-value decisions and test filters, empty states and unusual values with realistic sample data.
- 3
Release with calculation checks
Verify totals against source systems, document refresh failures and agree who maintains each metric when the business changes.
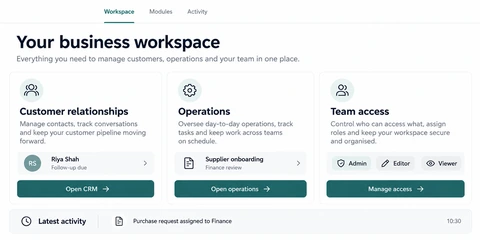
See the details.
Across every screen.
Explore the interface, then open any image at its original resolution.
Desktop experience
1 / 1Business dashboards
Scope, tradeoffs and preparation for your project.
Do we need real-time reporting?
Only if the decision depends on immediate updates. Scheduled refreshes are often simpler and less costly for daily operational reporting.
Can the dashboard replace our BI tool?
Sometimes the right solution is configuration in an existing BI product. Custom development is more appropriate for embedded workflows, specialised access rules or actions tied to the data.
How will we know the numbers are correct?
Agree reference reports and test cases before building. Reconcile totals, rounding, dates and exclusions, and display the last successful update.
How we would validate this scope
Agree the important success and failure paths before development. These proposed checks help turn the service description into a reviewable delivery brief.
- A reference dataset produces the agreed totals, rounding and date-window calculations.
- A failed source refresh displays its age instead of presenting old figures as current.
- A drilldown cannot expose source records beyond the viewer’s permissions.
- Currency and time-zone differences remain explicit when comparisons are shown.
See the workflow in our project work
Explore the screens and decisions behind related user journeys. Each case study explains its project context; the service choice for your own project follows your requirements.
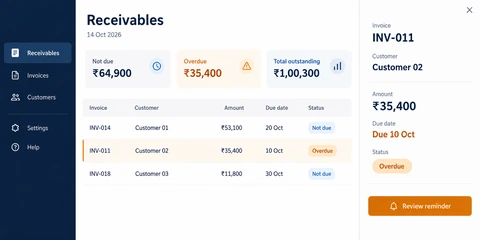
Invoice Management Software: Ledger
Outstanding and overdue summaries · Invoice list with date and status · Selected invoice detail and reminder review.
Read the project case study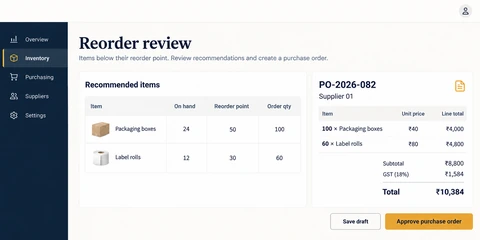
Inventory Management Software: Stockroom
Reorder thresholds and recommendations · Purchase-order line-item review · Separate draft and approval actions.
Read the project case studyDiscuss your business dashboards project.
Share your requirements so we can agree a focused scope, dependencies and the next useful step.